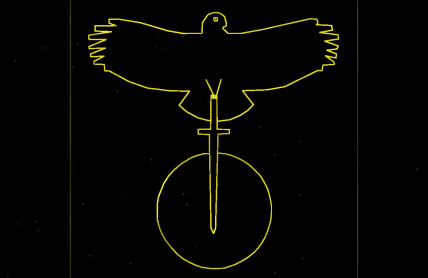
The Republic of Destructive Raiding Practices
Things explode
Region: Suspicious
Quicksearch Query: Destructive Raiding Practices
|
Quicksearch: | |
NS Economy Mobile Home |
Regions Search |
Destructive Raiding Practices NS Page |
|
| GDP Leaders | Export Leaders | Interesting Places BIG Populations | Most Worked | | Militaristic States | Police States | |

Things explode
Region: Suspicious
Quicksearch Query: Destructive Raiding Practices
| Destructive Raiding Practices Domestic Statistics | |||
|---|---|---|---|
| Government Category: | Republic | ||
| Government Priority: | Law & Order | ||
| Economic Rating: | Very Strong | ||
| Civil Rights Rating: | Below Average | ||
| Political Freedoms: | Some | ||
| Income Tax Rate: | 10% | ||
| Consumer Confidence Rate: | 100% | ||
| Worker Enthusiasm Rate: | 100% | ||
| Major Industry: | Retail | ||
| National Animal: | hawk | ||
| Destructive Raiding Practices Demographics | |||
| Total Population: | 5,517,000,000 | ||
| Criminals: | 613,283,434 | ||
| Elderly, Disabled, & Retirees: | 767,691,319 | ||
| Military & Reserves: ? | 227,115,641 | ||
| Students and Youth: | 910,305,000 | ||
| Unemployed but Able: | 859,932,321 | ||
| Working Class: | 2,138,672,284 | ||
| Destructive Raiding Practices Government Budget Details | |||
| Government Budget: | $17,509,683,887,603.71 | ||
| Government Expenditures: | $16,459,102,854,347.49 | ||
| Goverment Waste: | $1,050,581,033,256.22 | ||
| Goverment Efficiency: | 94% | ||
| Destructive Raiding Practices Government Spending Breakdown: | |||
| Administration: | $1,810,501,313,978.22 | 11% | |
| Social Welfare: | $1,810,501,313,978.22 | 11% | |
| Healthcare: | $2,304,274,399,608.65 | 14% | |
| Education: | $1,645,910,285,434.75 | 10% | |
| Religion & Spirituality: | $164,591,028,543.48 | 1% | |
| Defense: | $2,633,456,456,695.60 | 16% | |
| Law & Order: | $2,798,047,485,239.07 | 17% | |
| Commerce: | $493,773,085,630.43 | 3% | |
| Public Transport: | $1,645,910,285,434.75 | 10% | |
| The Environment: | $493,773,085,630.43 | 3% | |
| Social Equality: | $658,364,114,173.90 | 4% | |
| Destructive Raiding PracticesWhite Market Economic Statistics ? | |||
| Gross Domestic Product: | $14,531,700,000,000.00 | ||
| GDP Per Capita: | $2,633.99 | ||
| Average Salary Per Employee: | $4,416.57 | ||
| Unemployment Rate: | 23.43% | ||
| Consumption: | $74,509,293,138,739.20 | ||
| Exports: | $11,099,537,129,472.00 | ||
| Imports: | $11,371,140,874,240.00 | ||
| Trade Net: | -271,603,744,768.00 | ||
| Destructive Raiding Practices Non Market Statistics ? Evasion, Black Market, Barter & Crime | |||
| Black & Grey Markets Combined: | $26,393,878,019,221.94 | ||
| Avg Annual Criminal's Income / Savings: ? | $3,697.34 | ||
| Recovered Product + Fines & Fees: | $3,365,219,447,450.80 | ||
| Black Market & Non Monetary Trade: | |||
| Guns & Weapons: | $1,066,514,750,105.15 | ||
| Drugs and Pharmaceuticals: | $1,279,817,700,126.18 | ||
| Extortion & Blackmail: | $918,843,477,013.67 | ||
| Counterfeit Goods: | $1,837,686,954,027.34 | ||
| Trafficking & Intl Sales: | $787,580,123,154.57 | ||
| Theft & Disappearance: | $1,181,370,184,731.86 | ||
| Counterfeit Currency & Instruments : | $2,362,740,369,463.72 | ||
| Illegal Mining, Logging, and Hunting : | $525,053,415,436.38 | ||
| Basic Necessitites : | $1,181,370,184,731.86 | ||
| School Loan Fraud : | $754,764,284,689.80 | ||
| Tax Evasion + Barter Trade : | $11,349,367,548,265.43 | ||
| Destructive Raiding Practices Total Market Statistics ? | |||
| National Currency: | rubledollar | ||
| Exchange Rates: | 1 rubledollar = $0.31 | ||
| $1 = 3.20 rubledollars | |||
| Regional Exchange Rates | |||
| Gross Domestic Product: | $14,531,700,000,000.00 - 36% | ||
| Black & Grey Markets Combined: | $26,393,878,019,221.94 - 64% | ||
| Real Total Economy: | $40,925,578,019,221.94 | ||
| Suspicious Economic Statistics & Links | |||
| Gross Regional Product: | $336,902,560,457,687,040 | ||
| Region Wide Imports: | $45,169,080,130,338,816 | ||
| Largest Regional GDP: | Sparkdottir | ||
| Largest Regional Importer: | Sparkdottir | ||
| Regional Search Functions: | All Suspicious Nations. | ||
| Regional Nations by GDP | Regional Trading Leaders | |||
| Regional Exchange Rates | WA Members | |||
| Returns to standard Version: | FAQ | About | About | 483,422,544 uses since September 1, 2011. | |
Version 3.69 HTML4. V 0.7 is HTML1. |
Like our Calculator? Tell your friends for us... |